From Curiosity to System
Building the Global OEM System Stack: A Product Case
Modern vehicles are no longer purely mechanical products. They are complex digital systems supported by software platforms, data infrastructure, semiconductor supply chains and cloud services.
Yet the structure of this ecosystem is rarely made visible.
Over the past few years I’ve become increasingly interested in how it actually fits together. The industry is often described as a software-defined platform economy, but the relationships between manufacturers, suppliers and technology providers are difficult to see as a whole.
This curiosity led to a small side project: an interactive map of the global automotive ecosystem.
What began as an exploratory exercise evolved into a working prototype — the Global OEM System Stack Explorer — developed using the Double Diamond framework.
The project became a practical way to apply product thinking to a complex system problem.
The Double Diamond Approach
The project evolved using the Double Diamond framework as a way to move from exploration to structure, and from experimentation to a working system.
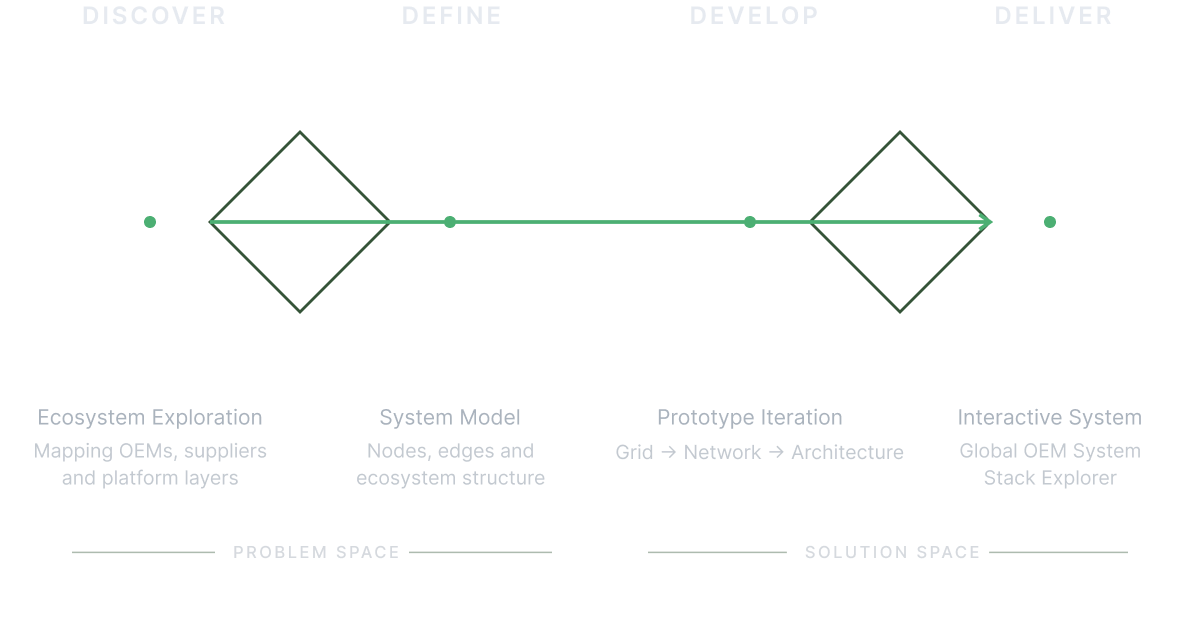
Applying the Double Diamond framework to the development of the OEM System Stack Explorer
Rather than treating the model as a rigid process, it was used as a way to navigate a complex problem space — iterating between understanding the ecosystem and shaping a usable representation of it.
In practice, this translated to four phases:
Discover - exploring the automotive ecosystem and identifying patterns across OEMs, suppliers and platform layers.
Define - structuring those relationships into a coherent system model using nodes, edges and categories.
Develop - iterating on different visualisation approaches to make the system readable.
Deliver - converging on an interactive prototype that allows the ecosystem to be explored.
This structure helped turn an initially unbounded problem into something that could be progressively refined.
Discover
Understanding the Automotive Ecosystem
The discovery phase focused on exploring the breadth of the automotive technology ecosystem.
The industry today operates across multiple overlapping technology layers, including:
Vehicle operating systems
Connectivity platforms
Data and analytics infrastructure
Cloud platforms
Semiconductor supply chains
Energy and charging ecosystems
Insurance and mobility services
Each OEM interacts with dozens, sometimes hundreds of suppliers and technology partners across these layers.
However, publicly available information about these relationships is often fragmented across press releases, supplier announcements, technical documentation and industry reports. Understanding the broader system requires synthesising information from many different sources.
The discovery phase therefore focused on:
Identifying major OEMs and suppliers
Mapping technology layers across the vehicle stack
Identifying common platform categories
Collecting publicly available partnership information
Observing how relationships cluster across regions
One insight became clear early in the process, the automotive ecosystem behaves far less like a traditional supply chain and far more like a technology platform network.
Define
Structuring the System
Once the exploration phase surfaced the complexity of the ecosystem, the next step was to structure the information in a way that could be modelled.
The project converged on a simple but flexible graph data model built around two core components.
Nodes
Nodes represent entities within the ecosystem, including:
OEMs
Suppliers
Platform providers
Infrastructure services
Regulatory bodies
Edges
Edges or links represent relationships between those entities, such as:
Supplier relationships
Platform integrations
Infrastructure dependencies
Ecosystem partnerships
Additional attributes were introduced to organise the data:
Ecosystem layers
Geographic regions
Supplier categories
Relationship types
The objective was not to produce a perfect representation of the industry. Instead, the model was designed as a structured hypothesis of the ecosystem — something that could evolve as more information becomes available.
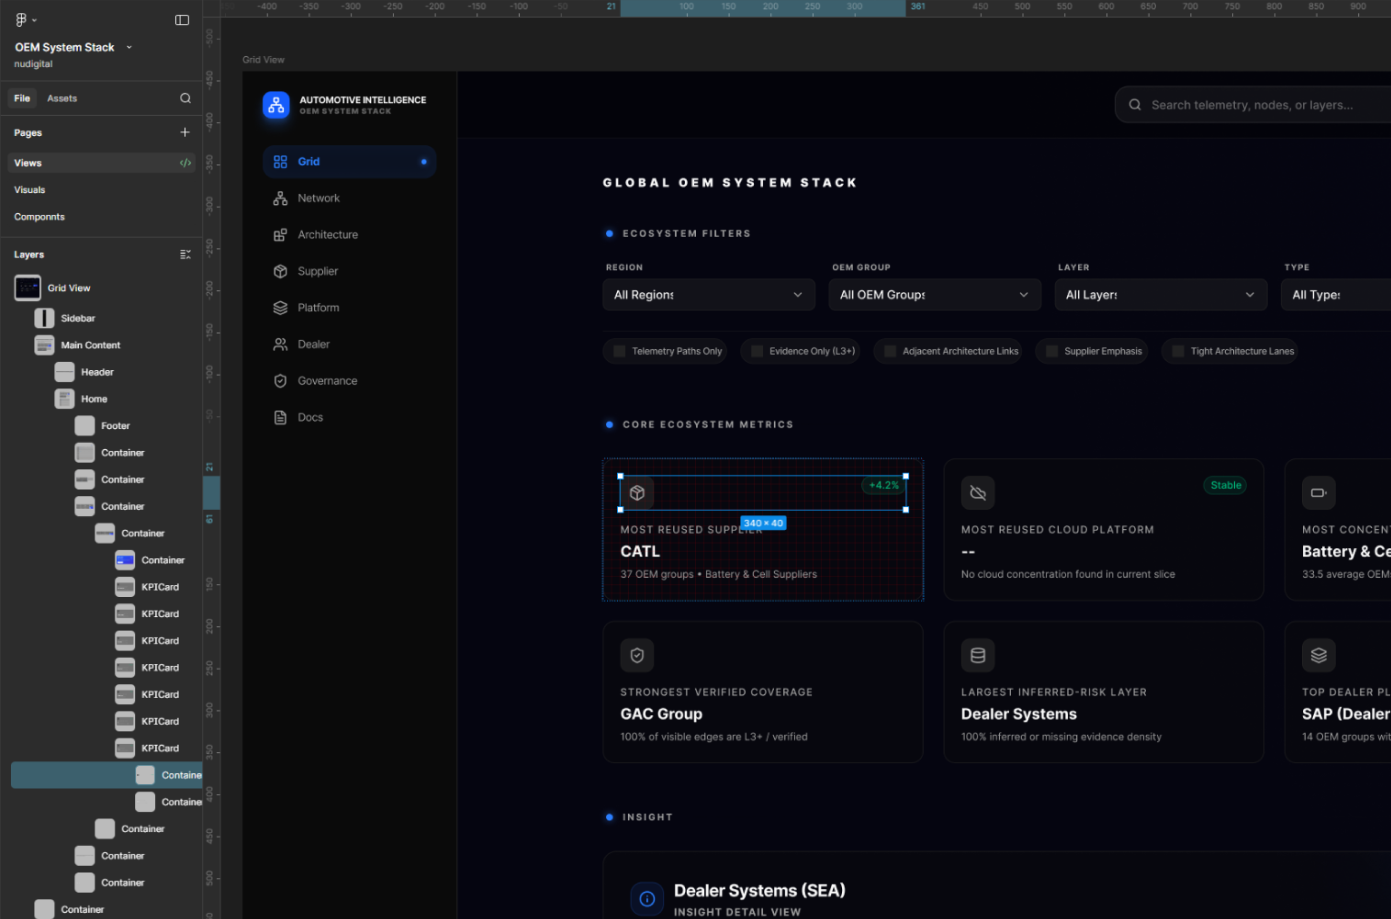
Global OEM System Stack Figma Design
Develop
Iterating Toward a Usable Visualisation
With a basic data model established, the next phase focused on exploring how the ecosystem could be visualised.
Network visualisation tools provide a natural way to represent complex systems, and the prototype uses D3.js to render interactive relationship graphs.
Several interface approaches were explored during development.
Grid View
A structured overview presenting ecosystem layers and key suppliers in a hierarchical layout.
Network View
A dynamic graph allowing users to explore relationships between OEMs, suppliers and technology platforms.
Architecture View
A layered representation showing how different platform categories interact within the broader automotive technology stack.
Each iteration helped expose new design challenges.
For example:
Complex graphs can quickly become visually overwhelming
Relationships must cluster into readable patterns
Filtering and label density must adapt across zoom levels
These challenges reinforced an important product principle — Complex systems require iterative visual design.
Deliver
Launching the Interactive Prototype
The current prototype is available here:
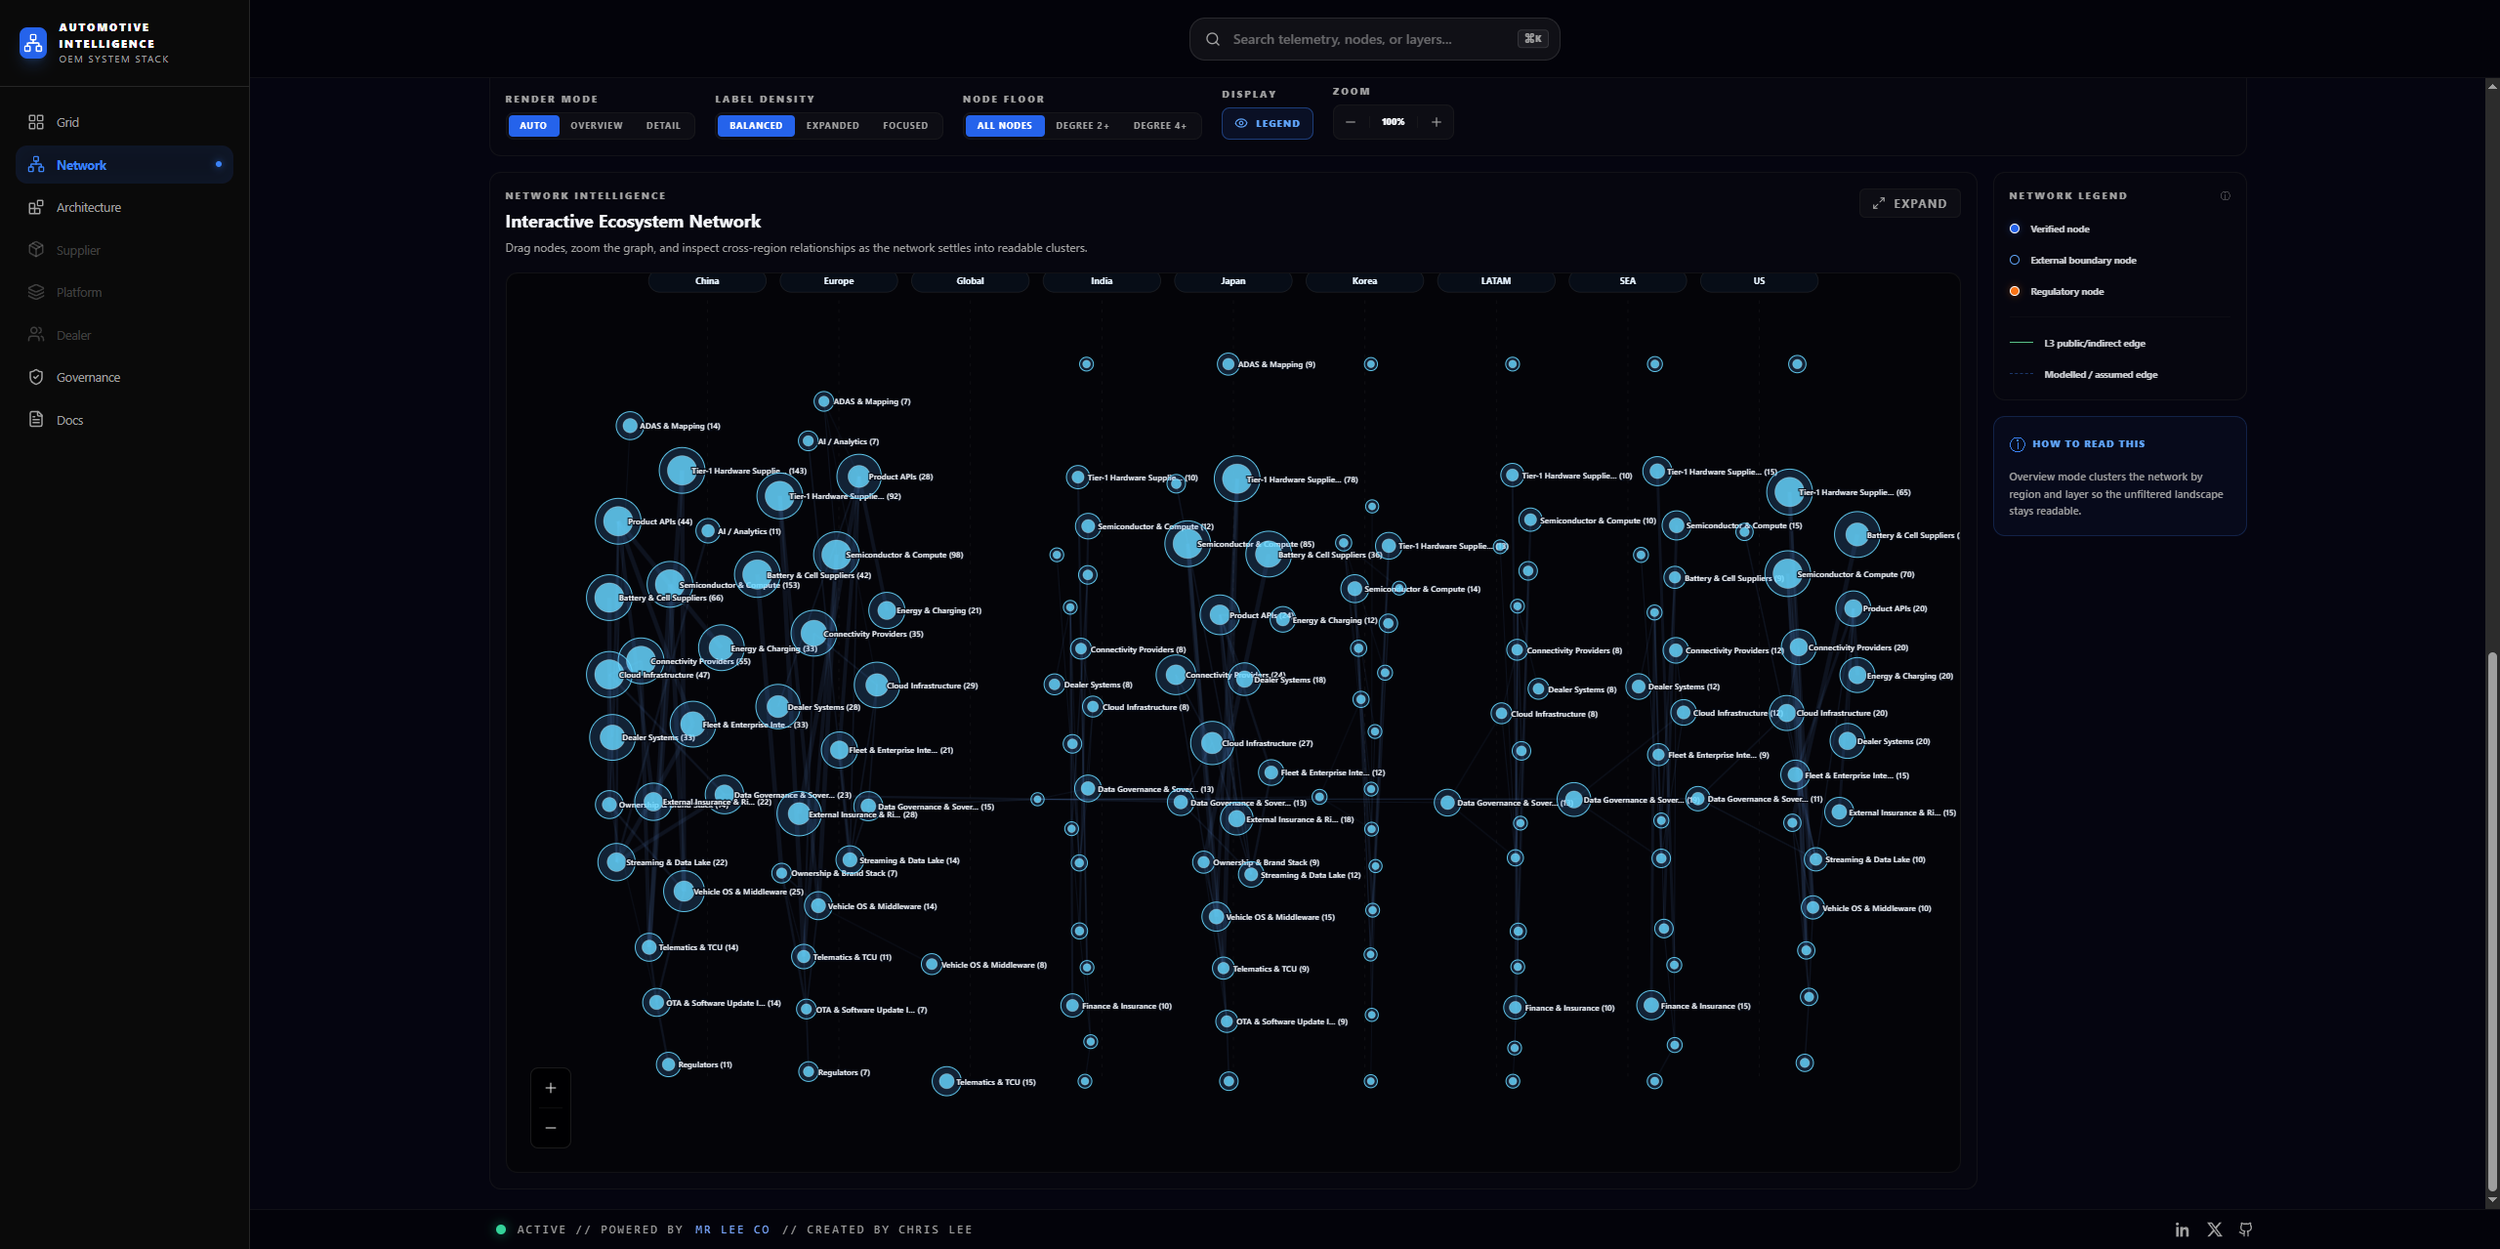
Global OEM System Stack prototype - Network View https://cjleeau.github.io/oem-system-stack/
The prototype was built iteratively, with each release refining both the data model and the interaction design.
The current version allows users to explore the ecosystem in a few key ways:
Exploring relationships between OEMs and suppliers
Visualising how clusters form across the ecosystem
Inspecting technology layers within the automotive stack
Examining patterns across different regions
While still very much a work in progress, the prototype demonstrates how complex industry ecosystems can be made more understandable through structured data and interactive visualisation.
Some relationships within the model are derived from publicly available sources and industry reporting. They should therefore be interpreted as indicative rather than definitive.
Operating the Project
Although the system began as a personal exploration, it was developed using a lightweight but structured product workflow.
Even small projects benefit from clear tooling and documentation practices. Establishing these early made it easier to iterate quickly without losing track of decisions or research.
Source Control and Branching
The project is maintained in GitHub with a deliberately simple branching strategy appropriate for a single-developer environment.
The repository uses a primary main branch for stable builds, with feature branches created for new interface improvements or visualisation experiments.
For example:
feature/network-view-visualfeature/ui-improvementsfeature/data-expansion
This approach keeps the codebase stable while allowing experimentation without disrupting the working prototype.
Managing the Product Backlog
Backlog management is handled using GitHub’s built-in Kanban board.
The goal was not to replicate a full enterprise delivery framework, but to maintain visibility of work in progress and ensure that improvements were prioritised and completed in a structured way.
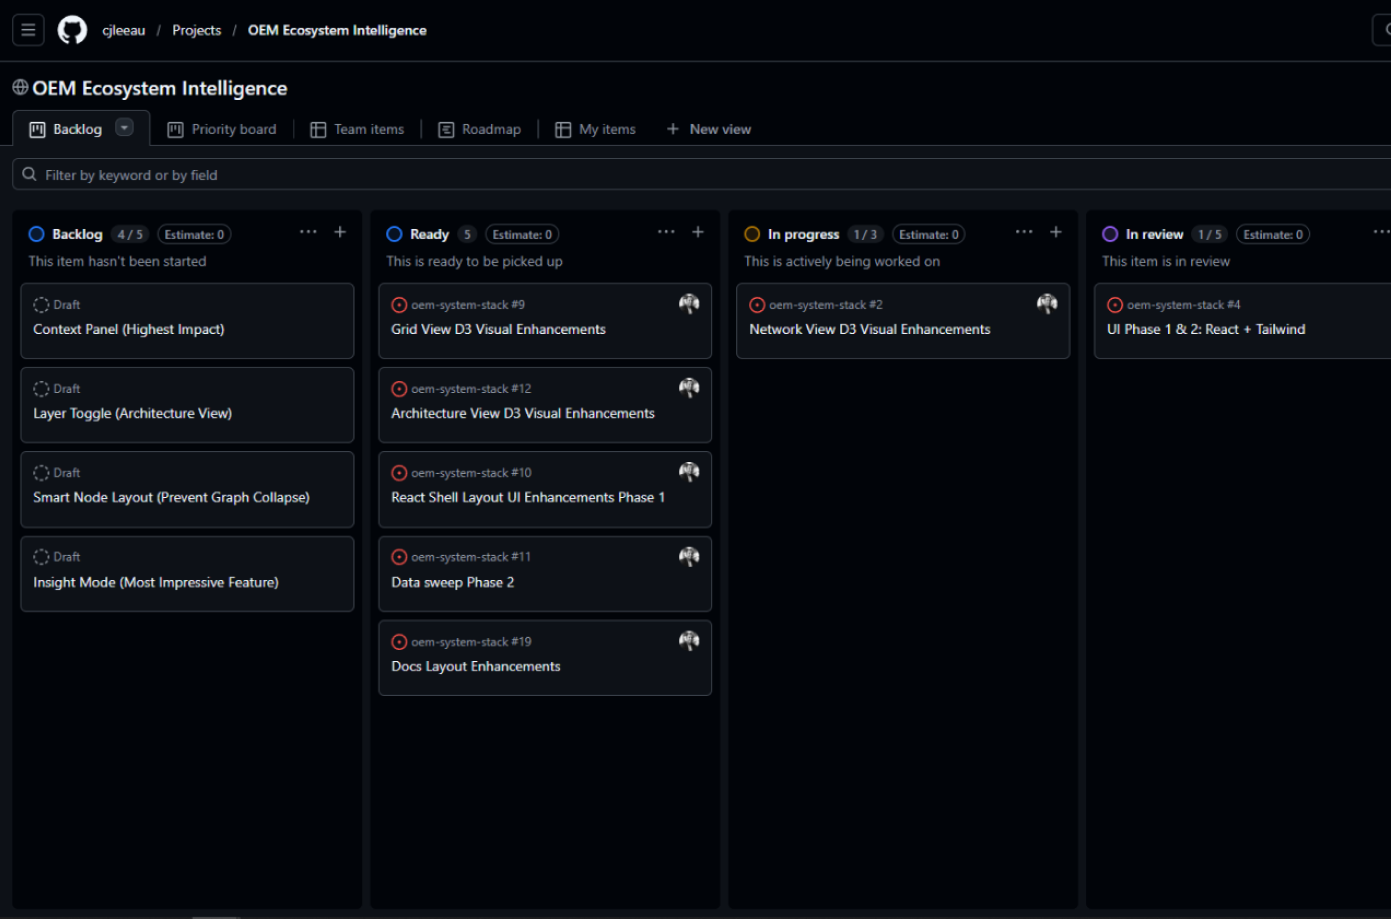
Github Global OEM System Stack backlog
Typical backlog items include:
Expanding ecosystem data coverage
Improving network graph interaction behaviour
Refining UI structure and layout
Extending the model to additional ecosystem layers
Even with a team of one, this simple structure helps maintain momentum and ensures the project evolves intentionally rather than randomly.
Documentation and Research
Research and documentation are maintained outside the codebase to keep exploratory work separate from implementation.
I used the following tools to support this process;
Notion
Used for documenting ecosystem observations, structuring research notes, and capturing evolving hypotheses about the automotive platform landscape.
NotebookLM
Used as a research companion to synthesise information from industry reports, technical documentation, and supplier announcements.
These tools helped transform fragmented industry information into structured insight that can eventually be reflected in the system model.
Interface Design
Interface exploration and visual structure are developed in Figma.
Rather than creating a heavy design system, the project uses a lightweight set of interface patterns and visual conventions to maintain consistency across views.
These include:
Layout patterns for system views
Interaction behaviours for network exploration
Consistent typography and spacing rules
A more formal design system could be introduced in future iterations if the product evolves further. For now, the focus remains on clarity and rapid experimentation.
Why This Matters
Many prototypes focus purely on the final interface. However, the real work of product development often happens behind the scenes.
Establishing simple workflows for source control, backlog management, documentation and design made it possible to iterate quickly while still maintaining structure.
Even for a single-person project, these practices help ensure the system evolves in a coherent way.
From Map to Model
At this stage, the system is still a representation — a structured map of entities and relationships. However, the intent is not simply to visualise the ecosystem.
The more useful shift is from mapping the system to modelling how it behaves, it is a map showing what exists. and the model begins to suggest how the system operates.
Even in its current form, the system starts to move in this direction:
Clusters begin to indicate platform gravity
Shared suppliers reveal hidden dependencies
Infrastructure layers emerge as structural anchors
Cross-regional patterns highlight variations in ecosystem strategy
These are not just visual observations, they are early signals of system behaviour and this distinction matters.
In complex industries, static diagrams often create a false sense of understanding — they show structure, but not interaction.
A model, even an incomplete one, creates a foundation for:
Exploring system dependencies
Identifying concentration risk
Understanding platform leverage points
Reasoning about how the ecosystem may evolve
The current prototype is intentionally incomplete, but it begins to move beyond description toward something more useful — a way to reason about the system, not just observe it.
What the System Reveals and Enables
Even in its early stages, visualising the ecosystem begins to reveal structural patterns within the industry.
The automotive industry is becoming a platform ecosystem
Suppliers increasingly cluster around shared infrastructure layers such as connectivity, compute and data platforms.
Software infrastructure is becoming a central node
As vehicles generate more data and rely more heavily on cloud infrastructure, software platforms and analytics capabilities become critical components of the ecosystem.
Supplier networks are highly interconnected
Many suppliers operate across multiple OEMs, creating shared dependencies that resemble technology ecosystems more than traditional linear supply chains.
These patterns are often difficult to detect when analysing individual partnerships in isolation.
Visualising the ecosystem makes them far easier to understand. However, the more interesting outcome is not just what the system shows — but what it enables.
Identifying data opportunities
By mapping how platforms and suppliers connect, it becomes easier to identify where data is generated, aggregated and potentially underutilised.
This creates opportunities to explore:
New data products
Cross-platform analytics capabilities
Improved visibility across the vehicle lifecycle
Understanding user and service journeys
While the system is modelled at an ecosystem level, it has clear implications for how user journeys are designed.
Customer experiences — from purchase through to servicing and ownership — are shaped by multiple underlying systems.
Mapping these dependencies provides a foundation for:
Identifying fragmentation across touchpoints
Improving continuity across digital and physical experiences
Designing more coherent service journeys
Informing product roadmaps
A clearer view of the ecosystem helps inform where product investment should be focused.
For example:
Which platforms are becoming critical dependencies
Where integration complexity is increasing
Which areas offer the greatest leverage for differentiation
This allows roadmaps to be shaped not just by internal priorities, but by structural realities within the ecosystem.
These implications reinforce a broader point, understanding the system is not an academic exercise — it is a practical foundation for making better product, data and service decisions.
Future Iterations
Like any product, the system will continue to evolve.
Future iterations may include:
Expanded supplier coverage
Dedicated supplier and platform views
Improved data validation workflows
Enhanced filtering and exploration tools
Deeper ecosystem layers such as dealer and mobility platforms
The goal is not simply to map the industry, but to develop a living analytical tool that evolves alongside the ecosystem it represents.
It’s Been Fun
This project started with a simple curiosity about how the automotive ecosystem fits together, by applying a structured product approach helped transform that curiosity into a working prototype.
The Double Diamond framework provided a useful way to move from exploration to structure — and from experimentation to delivery.
In many ways the project reflects a broader lesson in product development:
when a system is complex, the first step is often simply making the system visible.
Once the structure becomes visible, new insights begin to emerge.